Free Vanguard real return calculator
What has your Vanguard portfolio returned after inflation?
Upload your Vanguard report to see your real return, and whether you’d have done better in savings, global shares or a simple 60/40 fund. See an example
- Free
- Private
- ONS inflation to September 2026
Don’t have it yet? Download it from Vanguard1. Download your report from Vanguard
- Log in to Vanguard and open Documents, then Report generator → Go.
- Choose Client Transactions Listing - Excel.
- Set From date to before your first deposit and To date to today.
- Select Generate report, then download it from the top of your documents.
Common mistake: a From date after your first deposit. Earlier purchases go missing and the figures will be wrong. If you’re unsure, pick the month you opened the account.
Works with ISAs (including Junior and Lifetime ISAs), SIPPs and General Accounts.
Upload your Vanguard report2. Upload it here
Read in memory and never stored, unless you create an account to save it. We never ask for your Vanguard login.
Not ready to upload? See an example report
How to download your Vanguard report
It takes about a minute on Vanguard’s website. Open Vanguard (opens in a new tab)
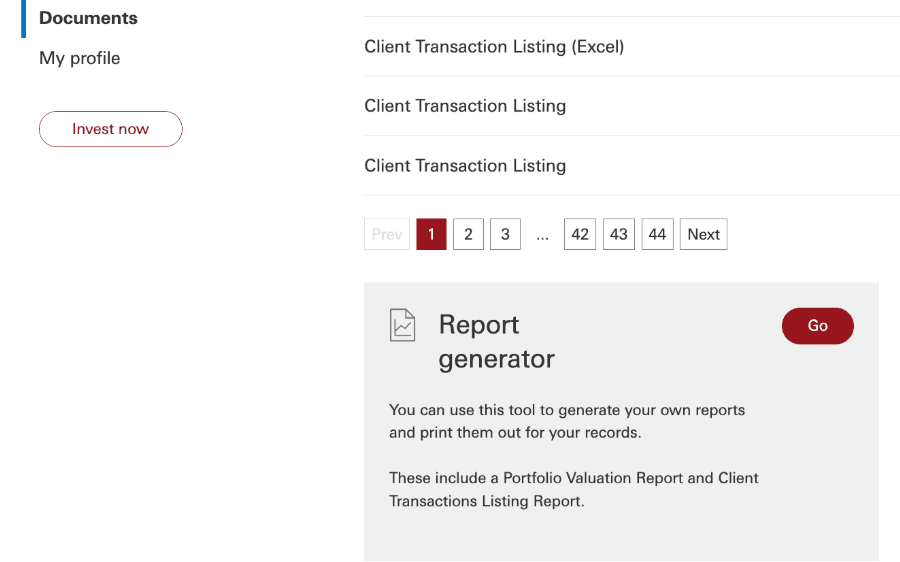
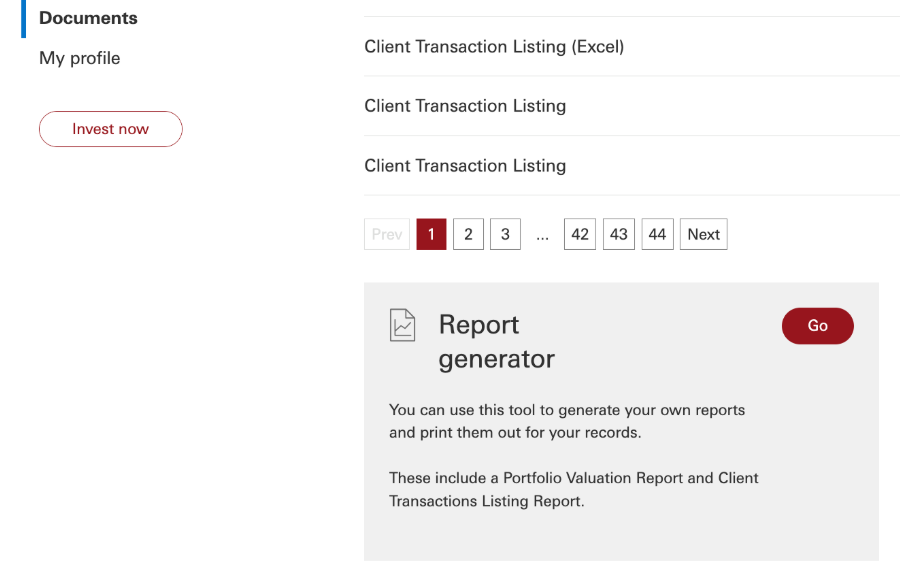
Step 1: Log in to Vanguard and choose Documents in the menu. Below your documents, find Report generator and select Go.
 Open full-size screenshot
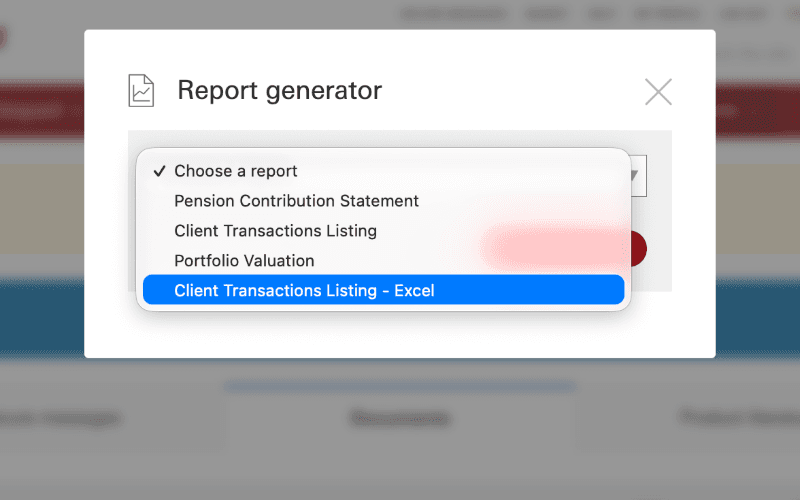
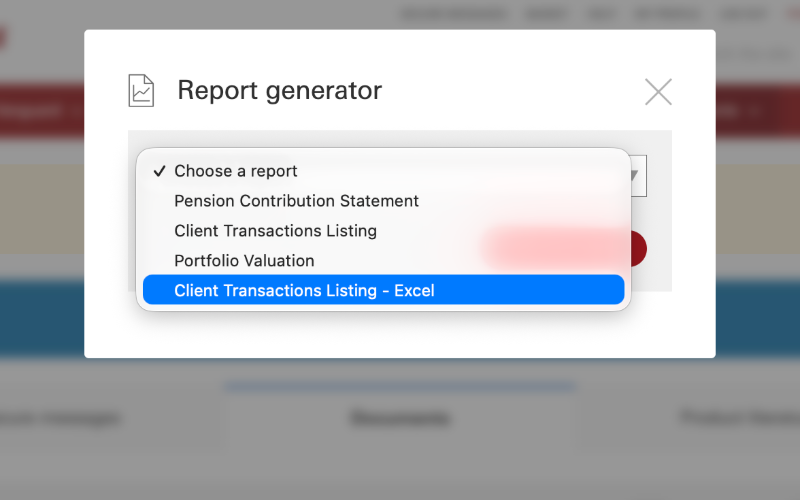
Step 2: Choose Client Transactions Listing - Excel. It has to be the Excel one: the other Client Transactions Listing won’t upload.
 Open full-size screenshot
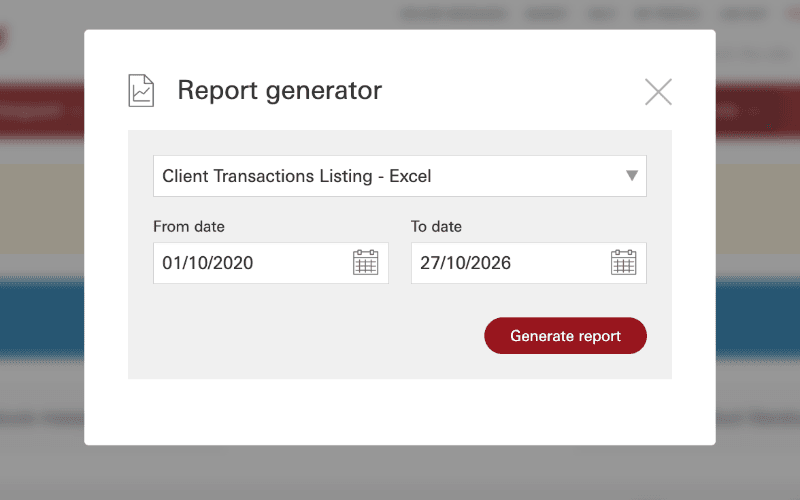
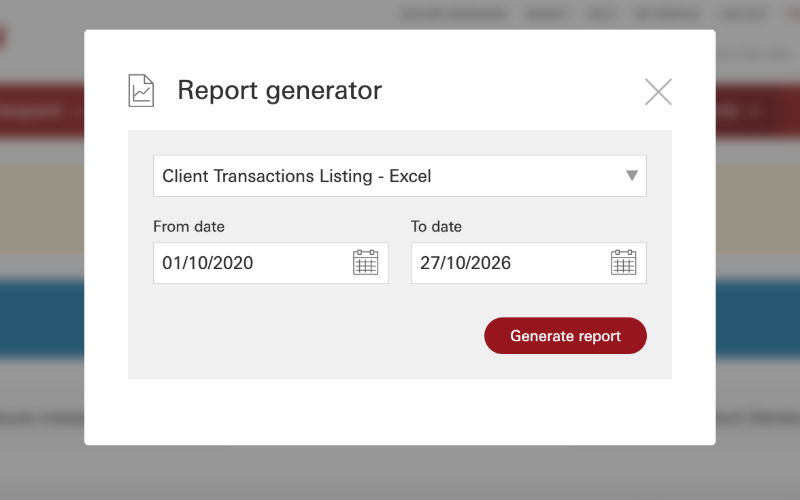
Step 3: Set From date to before your first deposit and To date to today, then select Generate report. If you’re not sure when you started, pick the month you opened the account.
 Open full-size screenshot
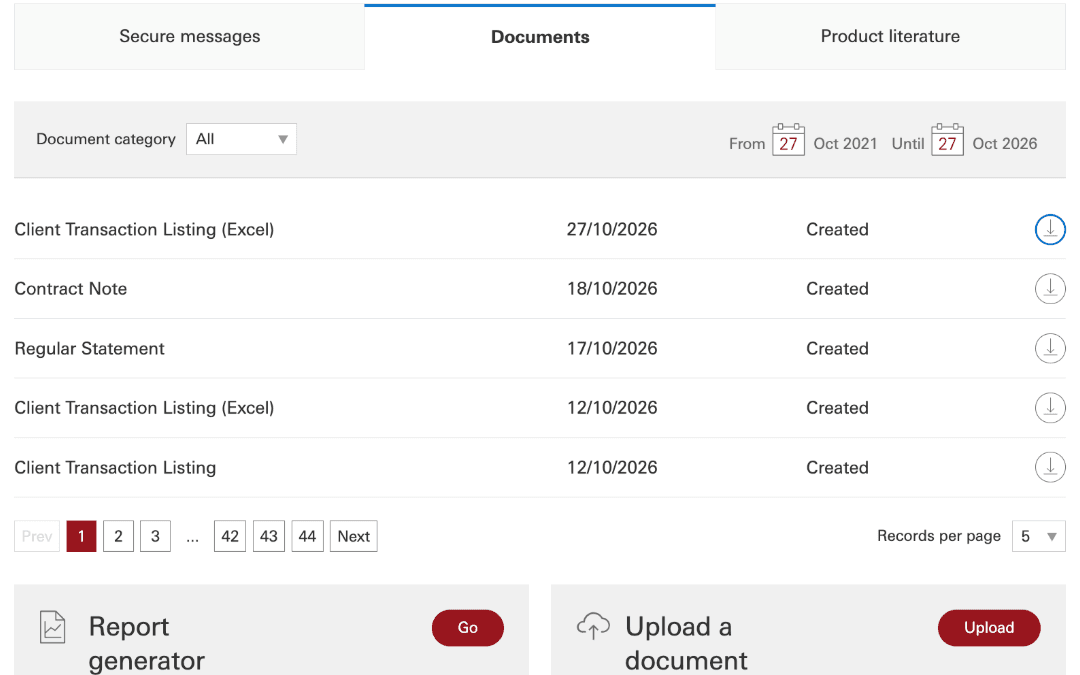
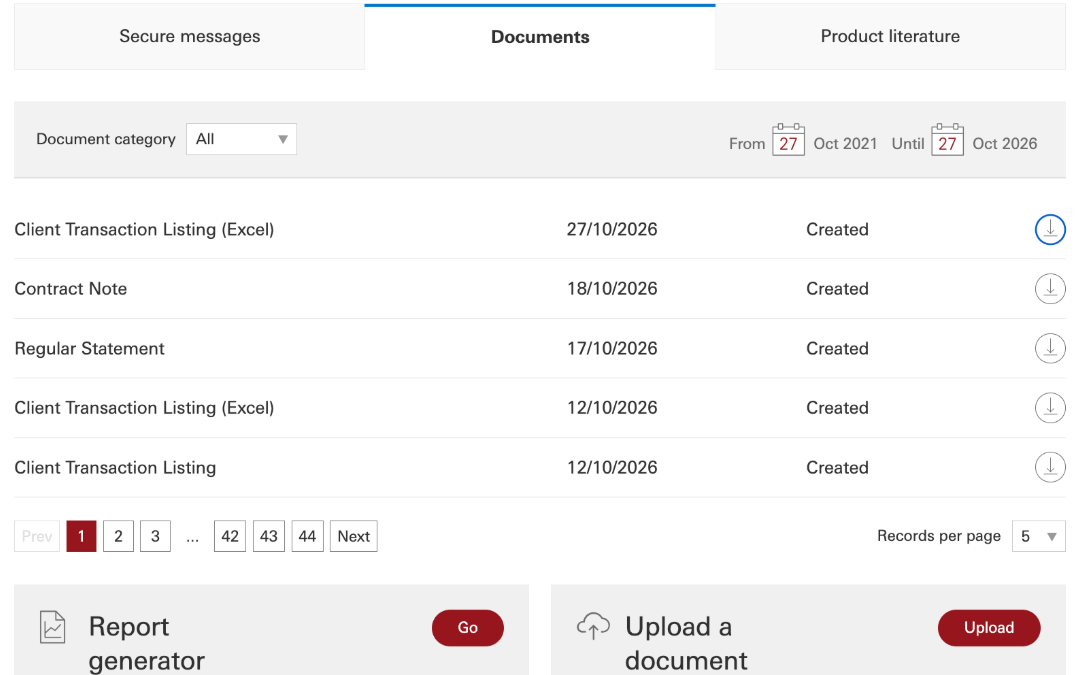
Step 4: Your report appears at the top of your documents as Client Transaction Listing (Excel), dated today. Select the download button beside it, then upload the file above.
 Open full-size screenshot
Questions
Do I need an account?
No. Your real return, how your value grew against what you paid in, how you did against a savings account, how much of this year's ISA allowance is left, what your funds cost and the long-term growth checks your portfolio passes are all free without an account. To compare your return with global shares and a 60/40 portfolio, see why any check is worth a look, see which low-cost Vanguard funds match your mix of shares, bonds and cash, and get your year-by-year returns, create a free Portfolio Coach account. Your portfolio is added to your new account automatically, and your full report is waiting on your dashboard, so you don't upload it twice.
Is it safe to upload my Vanguard report?
The report only lists your transactions. It doesn't contain your login details and can't be used to access your account. We read it in memory to build your report and don't store it. Only if you create an account do we keep it, just long enough to add your portfolio to that account, then delete it; if you never confirm your email, it's deleted after 7 days.
Why doesn't my return match Vanguard's?
It uses the same method, a money-weighted return, which measures what your money actually earned, so when and how much you paid in matters. Vanguard's "Your rate of return" is before inflation and for the whole period; we show it a year and after inflation. Your full report includes Vanguard's version too, so you can check them against each other. Small differences come from pricing: we value your portfolio at the latest prices, while Vanguard uses the previous close.
What is a real return?
Your investment return after inflation: how much more your money can buy, not just how many more pounds you have. Real return = (1 + return) ÷ (1 + inflation) − 1, so a 10% return in a year of 4% inflation is a real return of 5.8%. We use the ONS Consumer Prices Index (CPI), the headline UK inflation rate.
What are the long-term growth checks?
Five checks compare your holdings with a growth approach for money you won't need for many years: how much is in shares, how widely it's spread across the world, how much is in UK companies, how much sat in cash or money market funds, and whether a General Account is being used while ISA allowance looks unused. They can't see your goals, timeline or savings elsewhere, so holding more in bonds or cash can be right for you. They describe your portfolio; they aren't advice.
How does the savings account comparison work?
We put every deposit and withdrawal, on the same days, into a savings account paying the Bank of England's Bank Rate, with interest added daily as the rate changed. It pays no fees and no tax, and stands in for a good easy-access savings account. The rate comes from the Bank of England's database (series IUDBEDR).
How do you check the figures are right?
Your Vanguard report prints a running cash balance beside every cash entry. We add up every entry and check it lands on Vanguard's balance each day, and check each fund's units add up from its first purchase, which catches a file that starts too late. You can also type in the total from your Vanguard dashboard to compare it with our valuation.
How do the global shares and 60/40 comparisons work?
We put every deposit and withdrawal, on the same days, into one simple fund instead. Global shares stands in for Vanguard's FTSE Global All-Cap ETF (VALL), which charges 0.07% a year; it launched in August 2026, so we rebuild its history from Vanguard's FTSE Global All Cap Index Fund, adjusted to VALL's charge, and before November 2016 from the FTSE All-World ETF. The traditional 60/40 uses Vanguard LifeStrategy 60% Equity (Acc) at its actual prices. Both pay the same Vanguard account fees as you, on the same days, and are compared after inflation.
UK inflation by year
Annual CPI inflation (December to December), and what you’d need today to match £1,000 at the start of each year.
| Year | CPI inflation | £1,000 then is now |
|---|---|---|
| 2026to September | 2.9% | £1,029 |
| 2025 | 3.3% | £1,063 |
| 2024 | 2.6% | £1,090 |
| 2023 | 3.9% | £1,133 |
| 2022 | 10.5% | £1,252 |
| 2021 | 5.4% | £1,320 |
| 2020 | 0.6% | £1,328 |
| 2019 | 1.3% | £1,345 |
| 2018 | 2.1% | £1,374 |
| 2017 | 2.9% | £1,414 |
| 2016 | 1.6% | £1,437 |
| 2015 | 0.2% | £1,440 |
| 2014 | 0.5% | £1,447 |
| 2013 | 2.0% | £1,476 |
| 2012 | 2.6% | £1,515 |
| 2011 | 4.3% | £1,580 |
| 2010 | 3.6% | £1,638 |
| 2009 | 2.9% | £1,685 |
| 2008 | 3.0% | £1,736 |
| 2007 | 2.1% | £1,772 |
| 2006 | 3.0% | £1,826 |
| 2005 | 1.9% | £1,862 |
Source: ONS, CPI index (D7BT), 2015 = 100. Published 21 October 2026. Next update: 18 November 2026.

Built by Oliver Brenman, founder of Portfolio Coach, a portfolio tracker for UK investors, using the same engine as the app. Spotted a figure that looks wrong? Email support@portfoliocoach.co.uk. Portfolio Coach isn’t affiliated with Vanguard. Information, not financial advice.